XNGUSD, H4

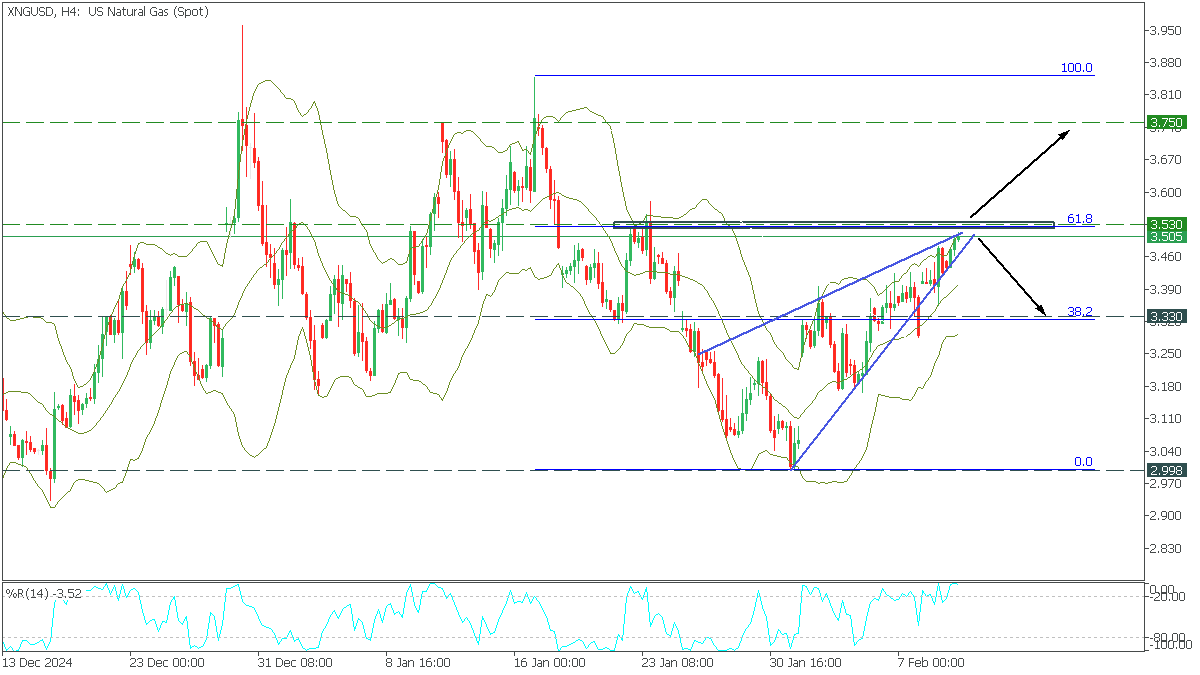
On the H4, XNGUSD formed a rising wedge pattern, and the price reached 61.8 Fibonacci. At the same time, the price crossed the upper Bollinger line. The %R also indicates a major overbought pattern.
- A break of resistance above 3.530 will open the way up to 3.750;
- A rebound from resistance and a break of the lower trendline will start a correction to 3.330;
